(This tab is only available if you have a license.) You can create, edit, import, and export cam tables in Configuration Tool.
Add a cam table
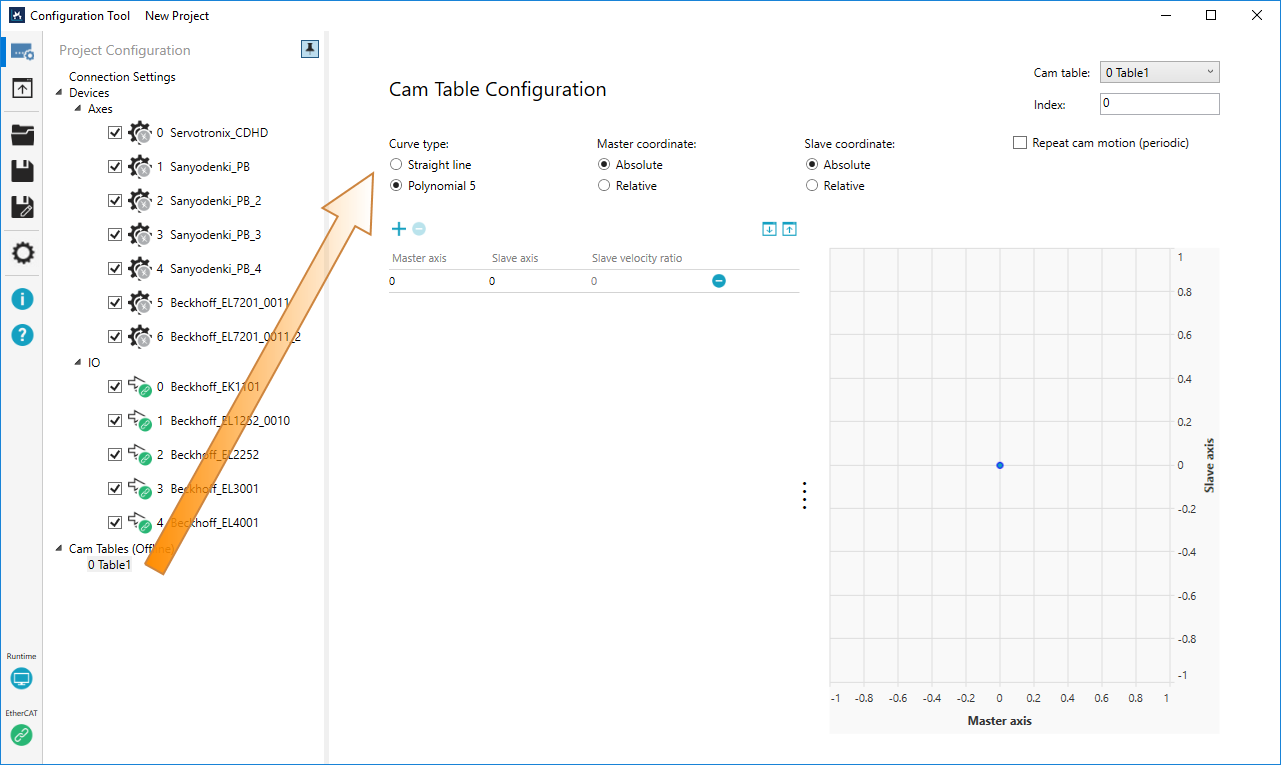
- On the Project Configuration list, right-click Cam Tables and click Add.
- On the Project Configuration list, click the cam table's name.
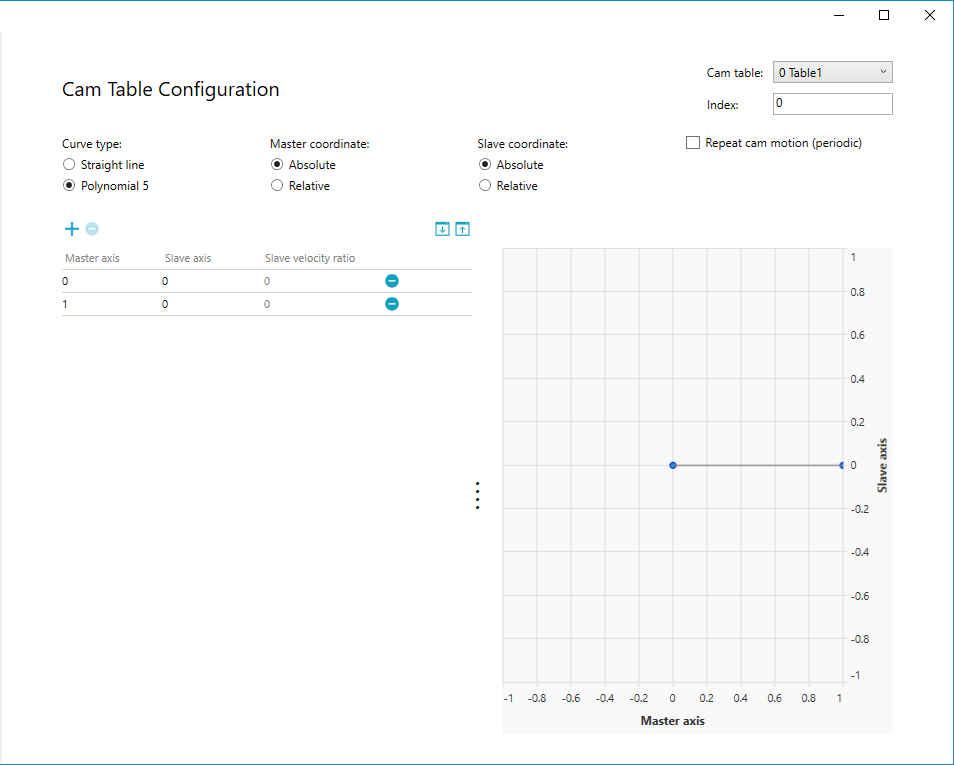
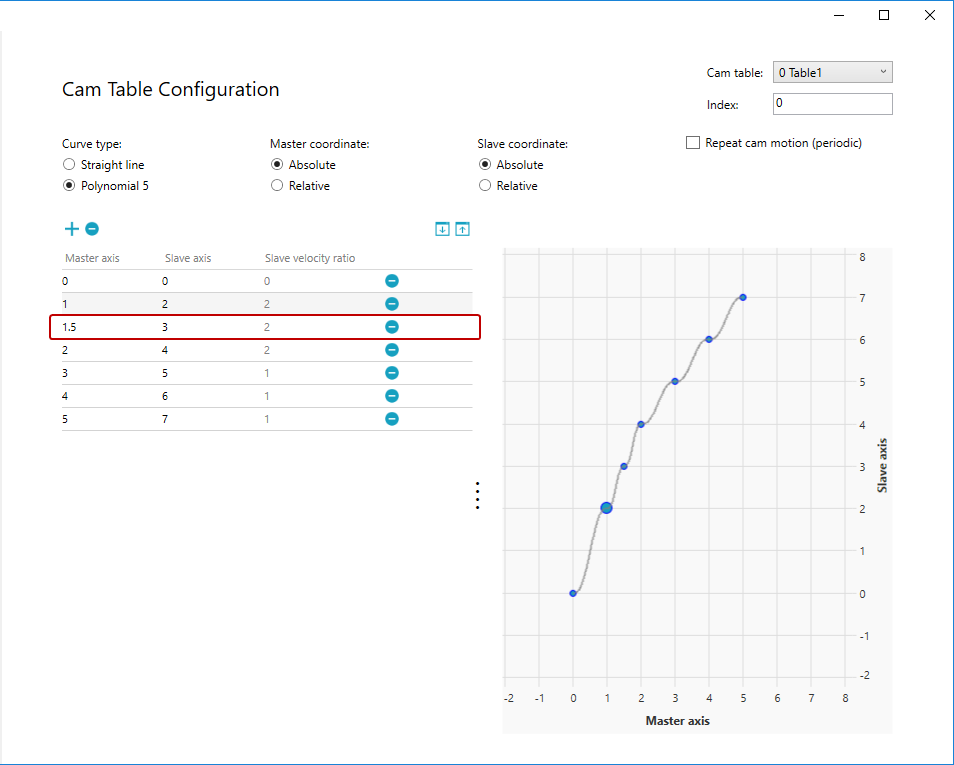
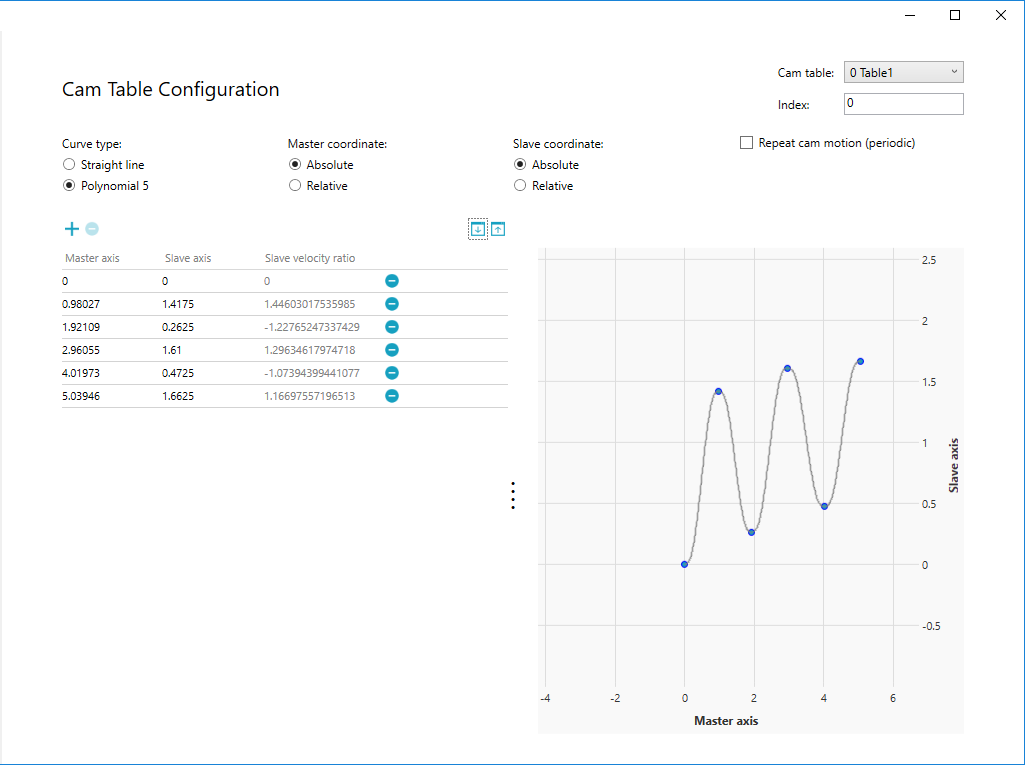
- On the Cam Table Configuration page, you'll see the following options.
- Curve type
- Master coordinate
- Slave coordinate
- Repeat cam motion (periodic): if selected, the cam profile will be repeated. For more information about periodic table, see Camming.
- Cam table (upper-right corner): the cam table list.
- Index (upper-right corner): the index of a cam table.
- In the position table, an entry is added, and the corresponding point is added to the graph. By default, the starting point is (0, 0).
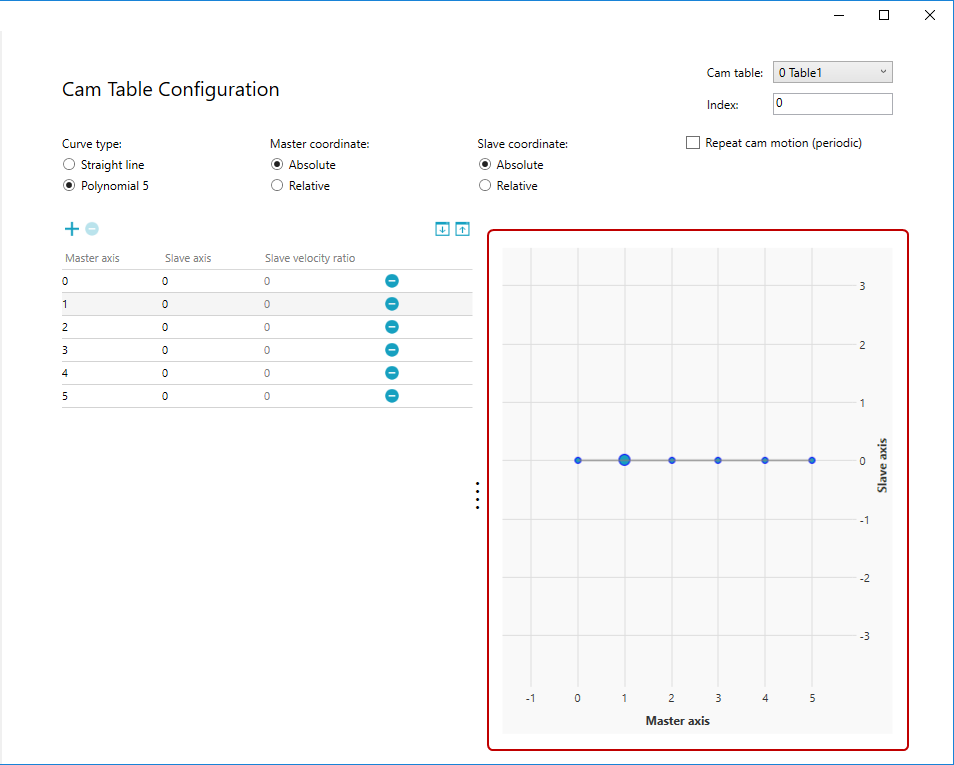
- Click
 to add more entries and points. Click
  to delete them. To get the full view of all the points, move the mouse pointer to the graph and scroll the mouse wheel to zoom in and out. To see the different part of the graph, press and hold the left mouse button, and move the mouse pointer on the graph.

Straight line: the cammed axes make linear moves.
Polynomial 5: a fifth degree polynomial interpolation is used between points. This interpolation type reduces the velocity and acceleration close to zero when changing a row. It reduces the jerk of the slave axis.
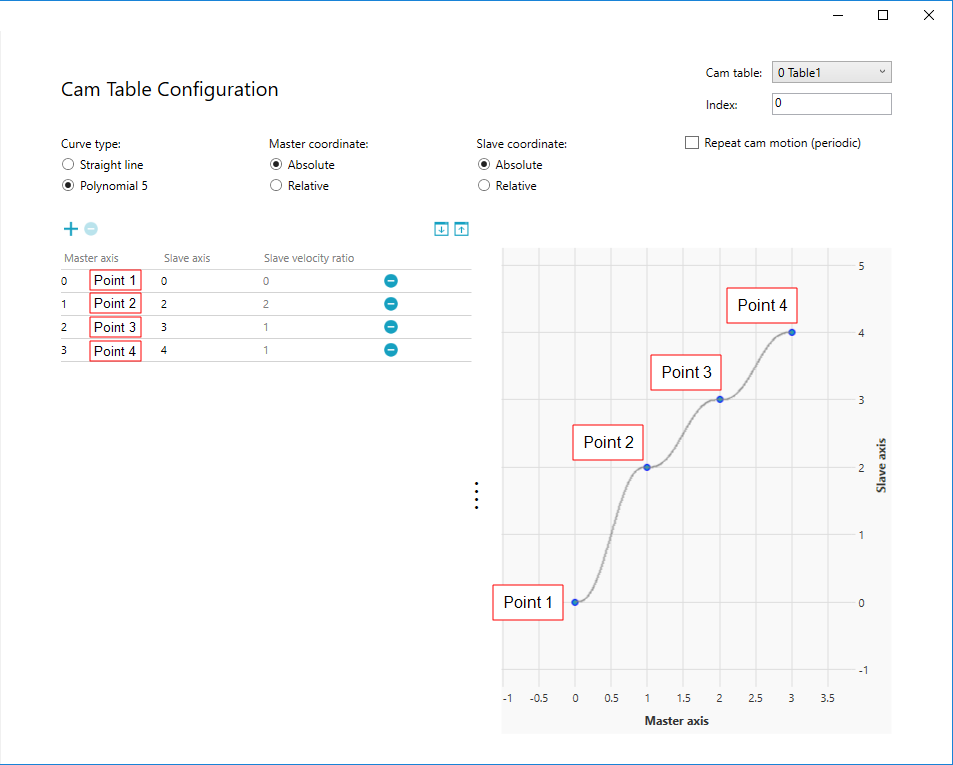
Absolute: every position is counted from zero. The next position value must be greater than the previous one. The points on the graph are the same as the ones you enter in the table.
Relative: the value should be greater than zero except for the starting point (the first row). The position is counted from the previous position in the table. For example, if the first four points are zero, one, two, and three, the points will be displayed at zero, one, three, and six on the graph.
| Points | Table | Graph |
|---|---|---|
| 1 | 0 | 0 |
| 2 | 1 | 1 (0+1) |
| 3 | 2 | 3 (0+1+2) |
| 4 | 3 | 6 (0+1+2+3) |
Point 1: zero.
Point 2: one. It is the distance between Point 1 and 2. The absolute position is one.
Point 3: two. It is the distance between Point 2 and 3. The absolute position is three.
Point 4: three. It is the distance between Point 3 and 4. The absolute position is six.
Absolute: every position is counted from zero. The points on the graph are the same as the ones you enter in the table.
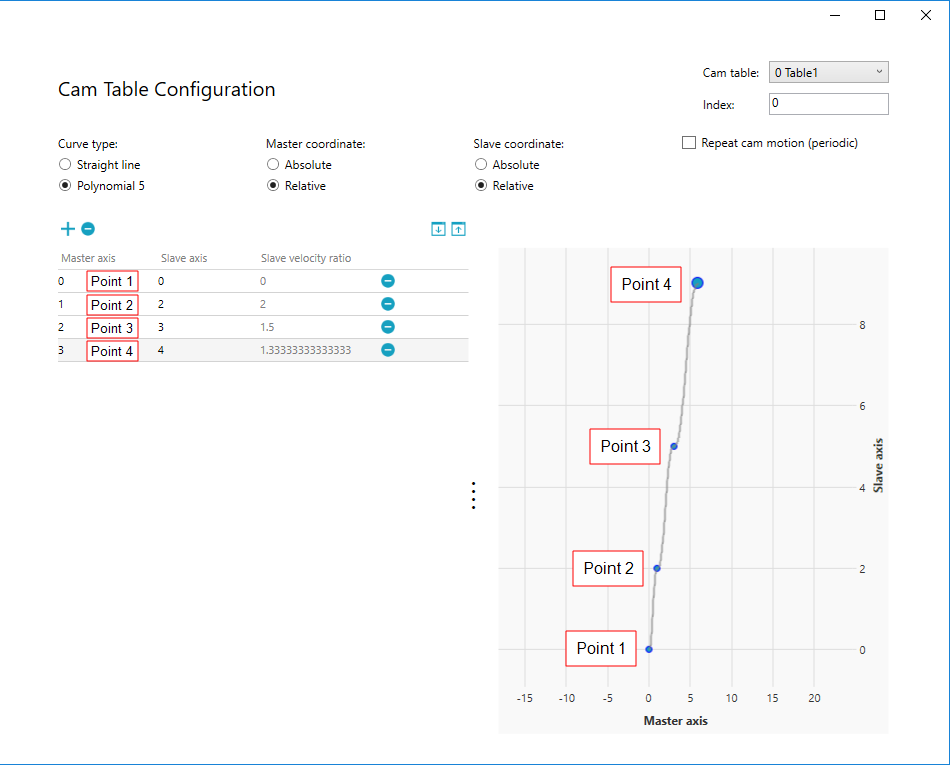
Relative: the position is counted from the previous position in the table. For example, if the first four points are zero, two, three, four, the points will be displayed at zero, two, five, and nine on the graph.
| Points | Table | Graph |
|---|---|---|
| 1 | 0 | 0 |
| 2 | 2 | 2 (0+2) |
| 3 | 3 | 5 (0+2+3) |
| 4 | 4 | 9 (0+2+3+4) |
Point 1: zero.
Point 2: two. It is the distance between Point 1 and 2. The absolute position is two.
Point 3: three. It is the distance between Point 2 and 3. The absolute position is five.
Point 4: four. It is the distance between Point 3 and 4. The absolute position is nine.
Absolute graph
Relative graph
In this guide, we select Polynomial 5, Master Absolute, Slave Absolute, and non-periodic. After the selection is done, click ![]() .
.
NOTE: The starting point doesn't have to be zero. You can edit it later.
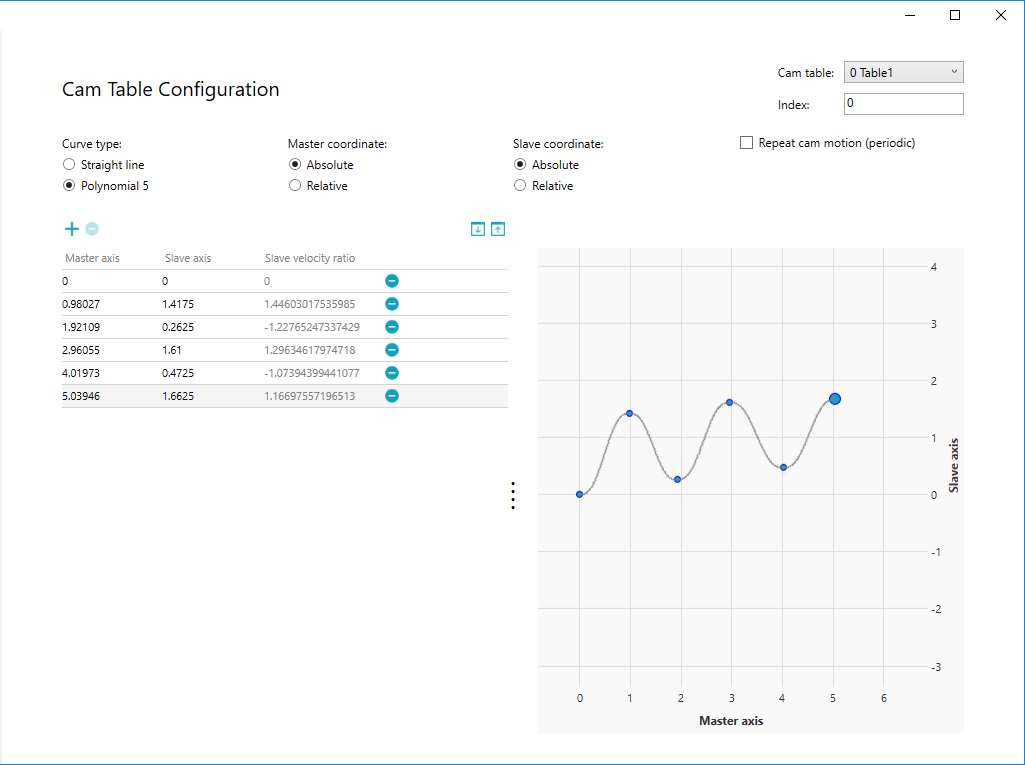
Click any point on the graph. The big point is the one in focus.
Edit a cam table
There are two ways to edit a cam table:
- In the position table, double-click one of the Master axis or Slave axis cell and change the value.
- Use the mouse pointer to move the point on the graph.
You can move the point on the graph first, and then adjust the value in the table.
Insert a row in the position table
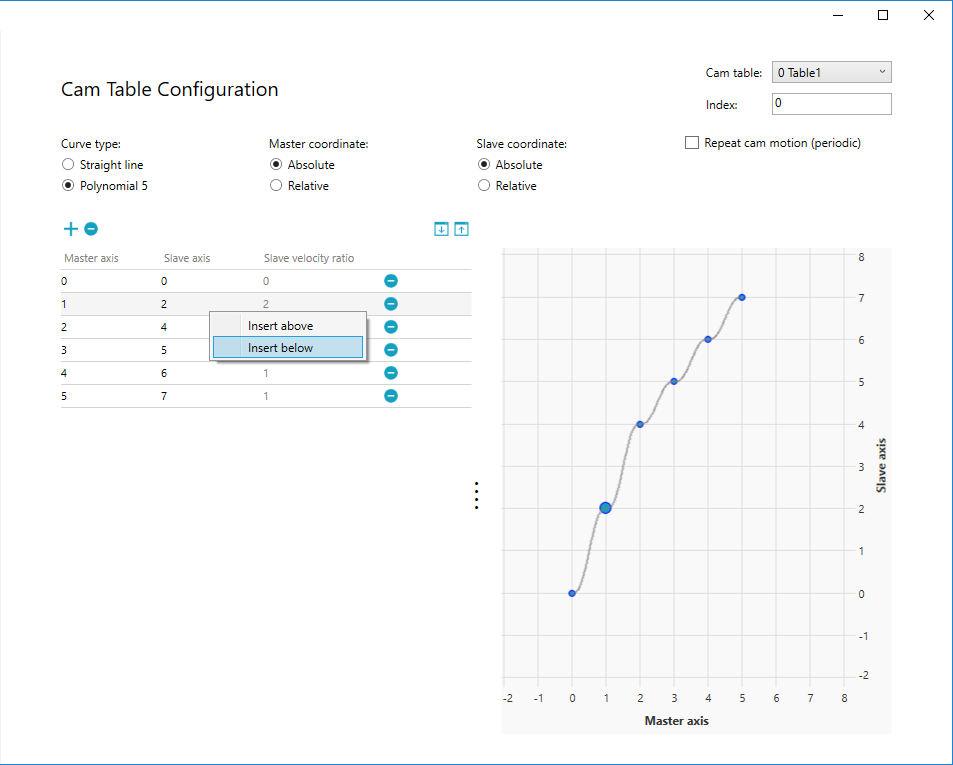
- To insert a row in the position table, right-click a row and select Insert above or Insert below.
- A new row is created. The value in the new row varies according to the mode you choose.
Insert above: insert a row above the current row.
Insert below: insert a row below the current row.
In this guide we select Insert below.
NOTE: For the first row, only Insert below is available; for the last row, only Insert above is available.
Absolute:
Master axis and Slave axis: the value in the new row is the average of the previous and next entries.
Relative:
Master axis: the value in the new row is the half of the next entry.
Slave axis: the value in the new row is the same as the previous entry.
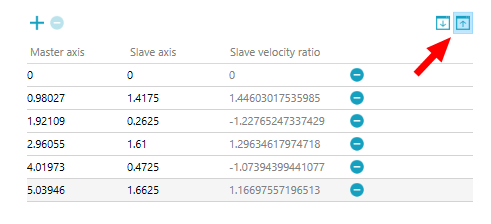
Export a cam table
- After editing the cam table, click Export (
 ).
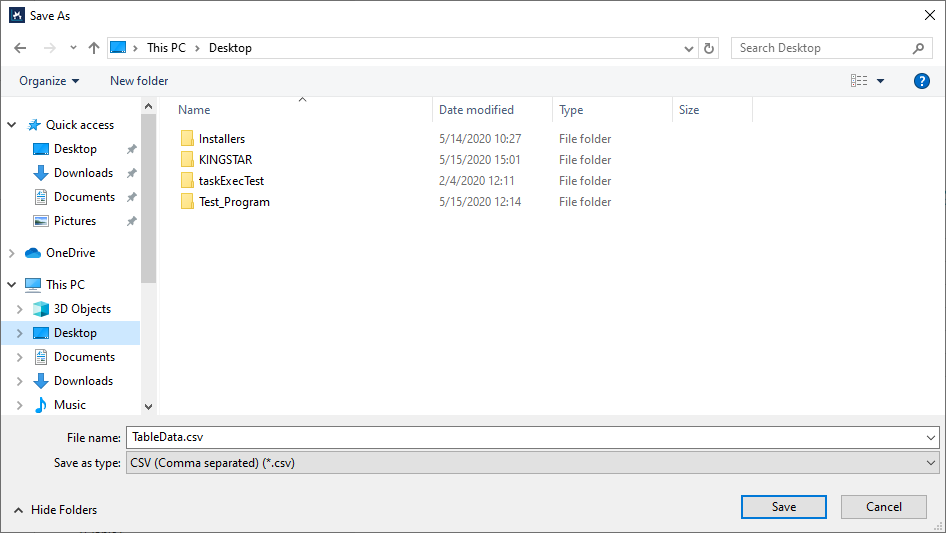
). - In the Save As dialog box, click Save to save the file as .csv.
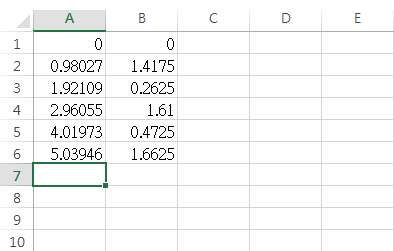
- Open the .csv file. You'll see two columns. From left, the first column contains the positions of Master axis and the second contains those of Slave axis.
Import a cam table
You can import a .csv file that contains positions of the master and slave axes.
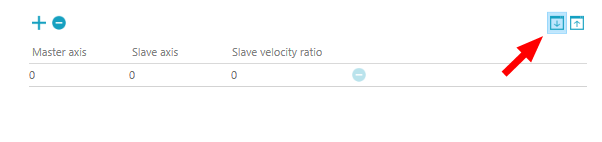
- After editing the cam table, click Import (
 ).
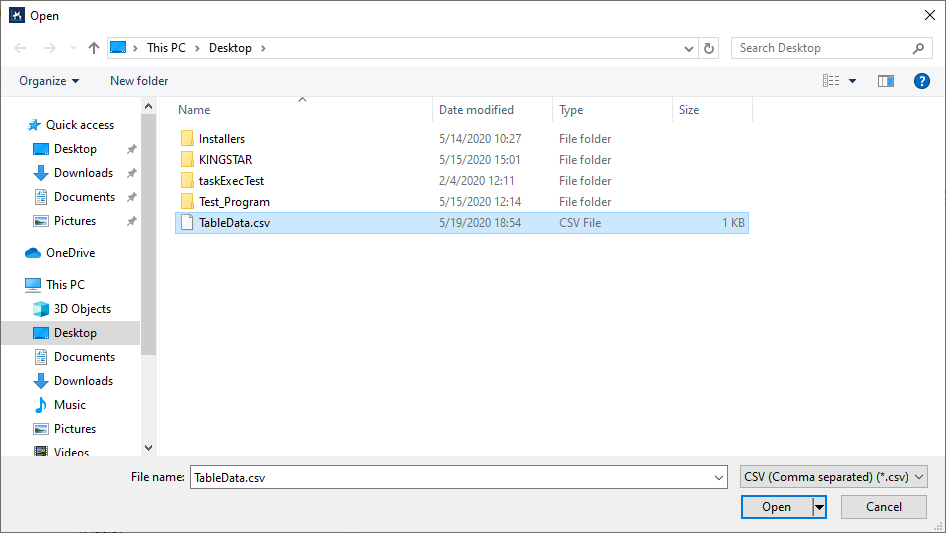
). - In the Open dialog box, select the .csv file that contains the positions of the master and slave axes, and then click Open.
- The file has been imported and displayed.
See also