This section provides the information about the user interface of KINGSTAR Analysis Console.
On the KINGSTAR Control Panel, click KINGSTAR Analysis Console to launch it.
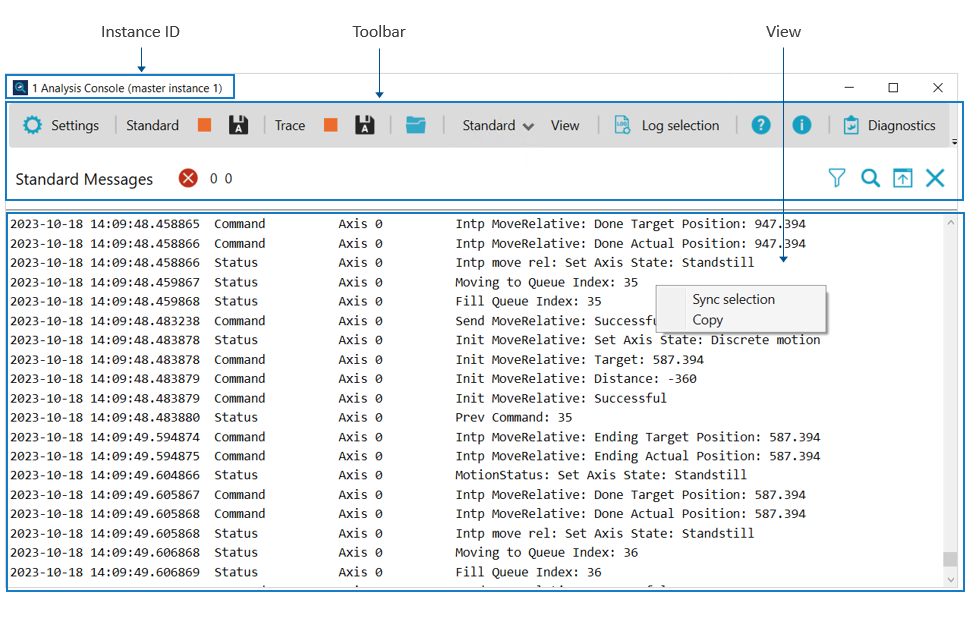
[Instance ID]: displays the instance ID. If you launch the Analysis Console through the KINGSTAR Control Panel, the instance of the Analysis Console will be applied with the one selected for the Control Panel. For example, if instance 1 is selected for the Control Panel, when launching the Analysis Console through Control Panel, the title bar of the Analysis Console will appear instance 1. If the Analysis Console is not launched through the KINGSTAR Control Panel, e.g. through Windows Start menu, the instance of the Analysis Console will be applied with 0.
NOTE: The title bar does not display instance 0; only the instances other than 0 will appear on the title bar.
[Toolbar]: you can perform the functions on the toolbar.
-
 Start /
 Stop: starts or stops recording standard messages.
 -
 Saves to files: saves the standard messages to .txt files. When this button is clicked, Analysis Console continues to save the log to files automatically. When this button is not clicked, the log is not saved. This button is available after you click .
- Trace: trace messages.
-
Start /
Stop: starts or stops recording trace messages.
-
Saves to files: saves the trace messages to .csv files. When this button is clicked, Analysis Console continues to save the log to files automatically. When this button is not clicked, the log is not saved. This button is available after you click .
-
 Open: opens the folder that saves log files.
 - Standard/Trace/Both View: displays the Standard or Trace view, or both of them.
- Standard View: to get the latest data, move the scroll bar to the bottom. The screen will be refreshed automatically. If you don't want this, move the scroll bar up. As long as the scroll bar is not at the bottom, new data won't be displayed.
- Trace View: to get the latest data, click
 to manually refresh the screen. When you click Trace's for the first time, the view will be switched to Both. From that point on, the view won't be switched automatically.
 - Both View: click to display both of the Standard View and Trace View.
-
 Log selection: selects the messages that is displayed while the KINGSTAR Subsystem is running.
- Standard messages: the general KINGSTAR messages.
- Trace messages: these messages may appear during every EtherCAT cycle. They display a large amount of information and should be used only when necessary.
-
 Help: displays the Analysis Console help.
 -
 About: information about Analysis Console.
 -
 Diagnostics: gets the EtherCAT slaves' information to know whether the slaves are working properly. See Diagnostic Tool.
 - Standard Messages: displays the number of error messages. The numbers suffixed to the
 icon represent the KINGSTAR error (left) and user error (right). Hover to the icon or numbers will display the error information.
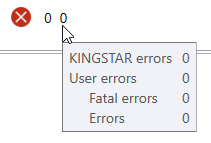
-
Refresh: refreshes the screen. This icon appears only in the Trace view.
-
 Filter: filters the messages.
 -
 Search: searches the messages.
 -
 Export: exports the displayed messages to a .txt file. For example, you can filter some messages and export them.
 -
 Clear: clears the messages.
[View]: shows the messages from KINGSTAR or user application. You can right-click in the View section to display the context menu.
- Sync selection: synchronizes the entries displayed in the Standard and Trace views.
- Copy: copies the selected messages.